The key facts
- NOAA estimates the probability of a strong El Niño early next year at 83% (forecast dated October 8, 2026).
- The 2026 map was built from data from the Sentinel-6 Michael Freilich satellite, the 1997 map from TOPEX/Poseidon data; both were processed by scientists at NASA's Jet Propulsion Laboratory.
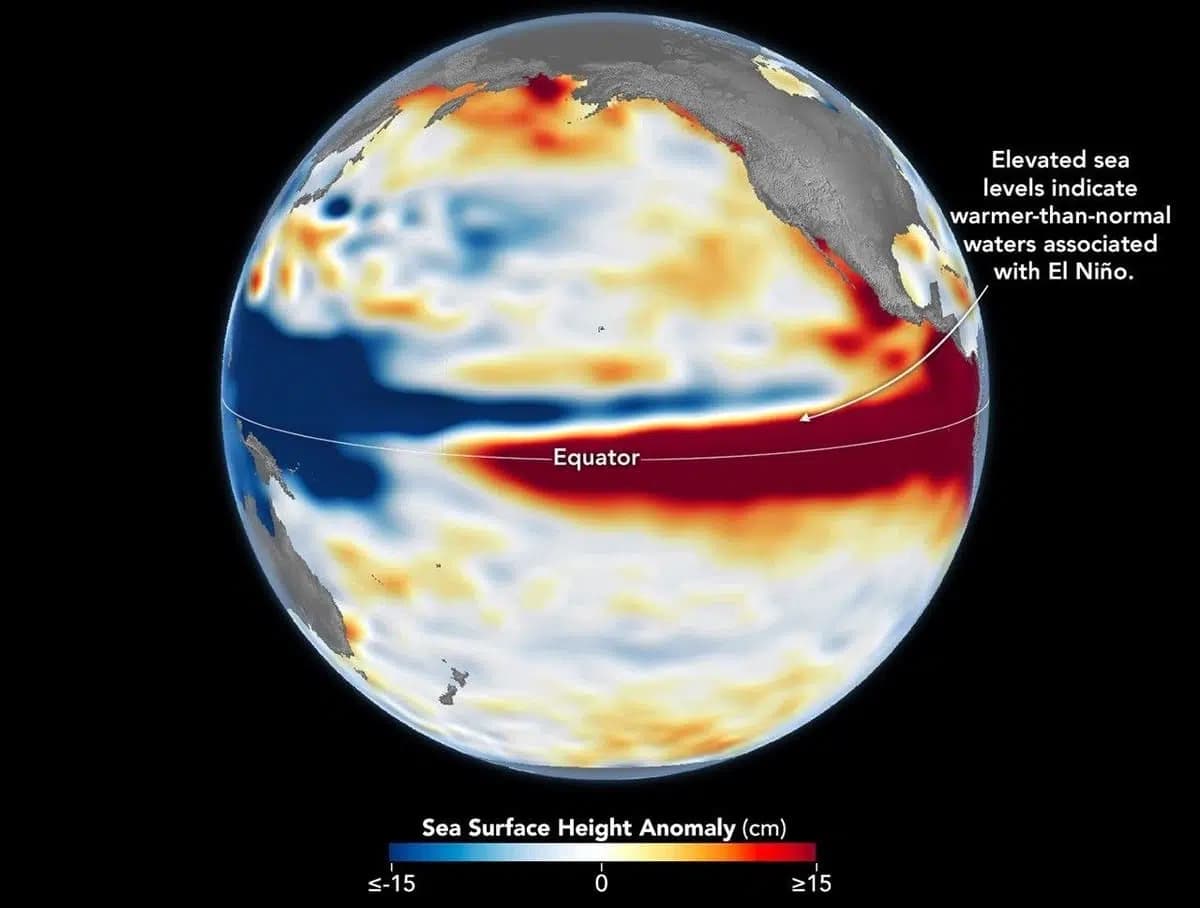
- By October 2026, the pattern resembled 1997: sea level is lowered in the western ocean and raised in the east, and warm waters have reached the coast of South America.
NOAA forecast: 83% probability of a strong El Niño
A forecast by the US National Oceanic and Atmospheric Administration (NOAA) dated October 8, 2026, indicates a high probability of a strong El Niño early next year — 83%. At the same time, as emphasized in the publication cited by Kun.uz, this does not mean that floods or droughts will necessarily occur in specific regions.
What the satellite maps showed
Scientists at NASA's Jet Propulsion Laboratory processed data on the height of the Pacific Ocean surface relative to the average level: the 1997 map (October 13) was built from measurements by the TOPEX/Poseidon satellite, and the 2026 map (October 12) from data from Sentinel-6 Michael Freilich. Surface height helps track where heat accumulates: water expands as it warms, so a rise in sea level in the central and eastern equatorial Pacific may indicate a buildup of heat associated with El Niño. Seasonal cycles and long-term trends were excluded from the data so that short-term events would be more clearly visible.
How 2026 differs from past strong El Niños
El Niño is part of a natural climate cycle that recurs roughly every two to seven years and is associated with warming water in the equatorial Pacific. The particularly strong episodes of 1997–1998 and 2015–2016 noticeably affected weather in various regions: from forest fires in Indonesia and the Amazon basin and crop failures caused by drought in southern Africa to heavy rains and floods in Southern California.
Comparing three episodes
According to the publication, the 2026 El Niño developed faster than the 1997–1998 event, but by October the pattern in both cases had become similar: sea level is lowered in the western ocean and raised in the east, and masses of warm water have reached the coast of South America. The strong El Niño of 2015–2016 unfolded differently: back then, the warm waters along the equator did not reach the coast of South America as far as they do now, which also led to a different territorial distribution of precipitation.
The mechanism of the phenomenon
Usually, trade winds push warm water toward the western Pacific. When the winds weaken, this water begins to shift eastward; the interaction between the ocean and the atmosphere further weakens the winds, and the accumulation of warm water in the central and eastern parts of the ocean intensifies. On the maps, red indicates a sea level above average, white — average, and blue — below average.