
The key facts
- The world's population grew roughly 2.7-fold from 1960 to 2025 — by 5.2 billion people
- The fastest growth was in Sub-Saharan Africa: 5.8-fold, to 1.32 billion people
- As of July 1, 2025, the World Bank moved Afghanistan and Pakistan from South Asia to the Middle East and North Africa group
The world's population has grown more than 2.7-fold over 65 years
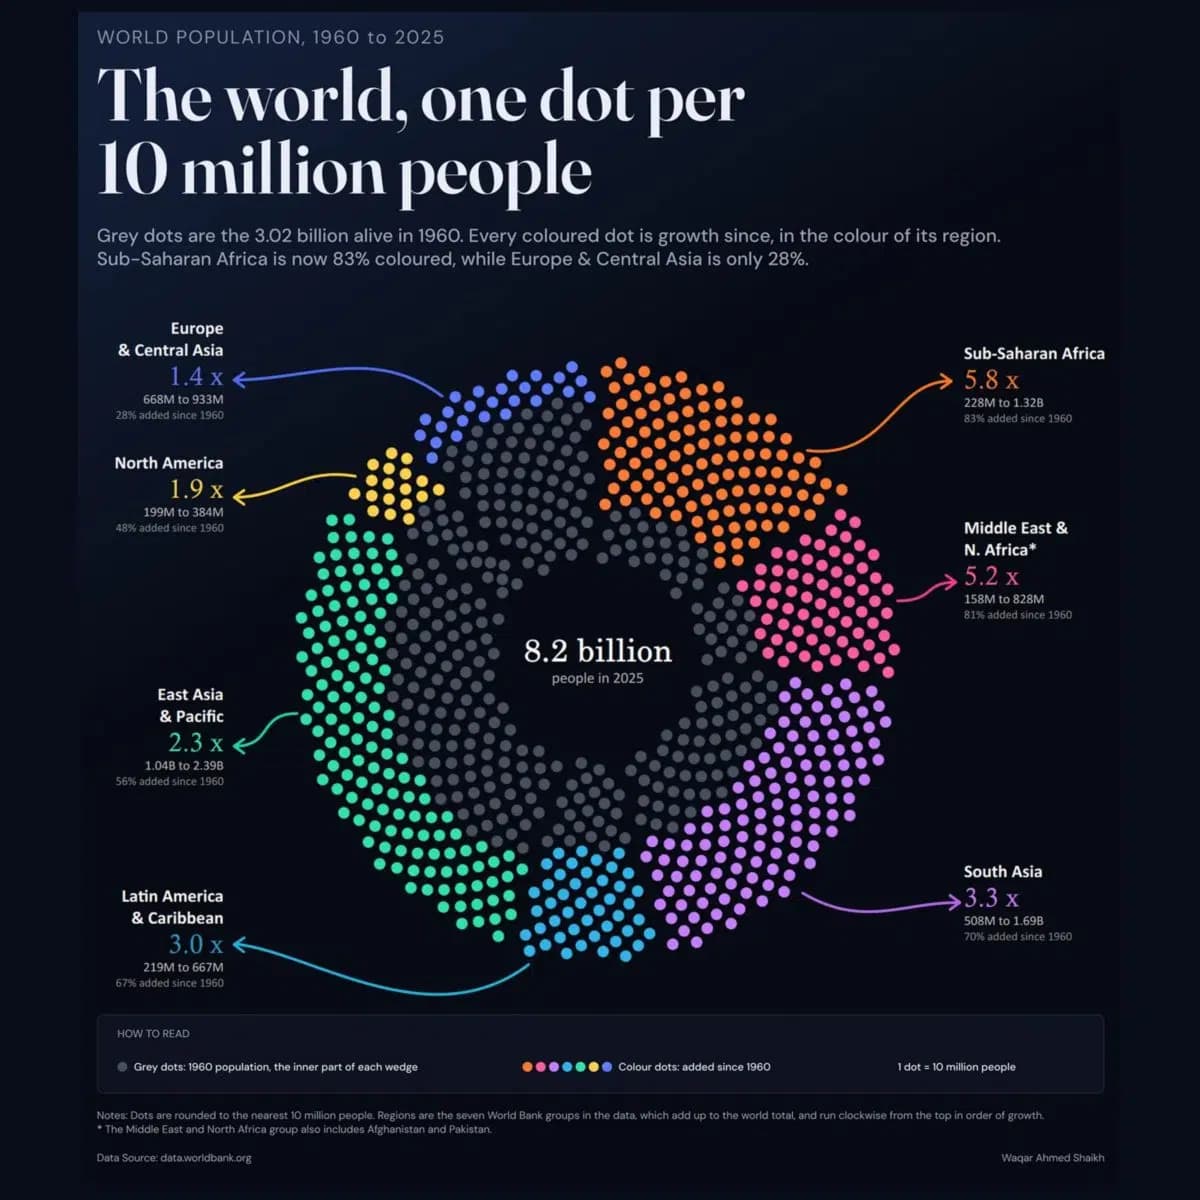
An infographic prepared by the Voronoi platform based on World Bank data shows how the world's population changed from 1960 to 2025 across seven regions of the planet. Over this period, the number of people on Earth grew roughly 2.7-fold — an increase of about 5.2 billion. Each dot on the image represents 10 million people: gray dots show the 1960 population, colored dots show the growth up to 2025; for clarity, figures are rounded to 10 million. This is reported by Kun.uz with reference to the publication of the infographic.
Where growth was fastest, and where it was largest
The largest relative growth was recorded in Sub-Saharan Africa: from about 228 million people in 1960 to 1.32 billion by 2025 — a 5.8-fold increase, with the region gaining more than a billion residents. It is followed by the Middle East and North Africa group, which also includes Afghanistan and Pakistan: the combined population grew from 158 million to 828 million, roughly a 5.2-fold increase. In Latin America and the Caribbean, the population nearly tripled — from 219 million to 667 million (an increase of 448 million). In South Asia, excluding Afghanistan and Pakistan, the number of residents rose from 508 million to almost 1.69 billion — an increase of about 1.18 billion, or 3.3-fold. The largest absolute increase was in East Asia and Oceania: from 1.04 billion to 2.39 billion people, that is, plus about 1.35 billion. However, this region was already the most populous in 1960, so its relative growth was only 2.3-fold.
Why the comparison relies on the new classification
An important methodological detail: as of July 1, 2025, the World Bank moved Afghanistan and Pakistan from the South Asia group to the Middle East and North Africa group. To make the comparison correct, regional figures for previous years were recalculated according to this new classification — that is why the South Asia figures in the infographic do not include these two countries, and their population is counted in the neighboring group. This explains why the regional data presented may not match the familiar divisions used in earlier World Bank publications.